
Marcia Gentry
University of Connecticut
Storrs, CT
Cluster grouping of students for instructional purposes is a programming strategy that can be used to meet the needs of high achieving and gifted students in the regular classroom. It has gained popularity in recent years due to heterogeneous grouping policies and financial cutbacks that have eliminated special programs for gifted and talented students (Purcell, 1994). Cluster grouping has been defined as the intentional placement of a group of high achieving or gifted students in an otherwise heterogeneous classroom with a teacher who has both the background and willingness to provide appropriate challenges for these students (McInerney, 1983). Research indicates three major benefits exist to cluster grouping. First, gifted students interact with their intellectual peers as recommended by Rogers (1991), as well as their age peers on a regular basis. Second, cluster grouping provides services for gifted students without additional cost to the school district. Third, recent research has demonstrated that cluster grouping facilitates ongoing programming for gifted or high achieving students in the regular classroom (Hoover, Sayler, & Feldhusen, 1993).
This study examined the effects of a cluster grouping program on the identification and achievement on students in a small, rural, mid-western school district that was purposefully selected because of its innovative use of cluster grouping. Cluster grouping in this district begins in grade 3 and continues through grade 5, with a yearly, flexible identification process beginning at the end of second grade that includes information from teachers, parents, and achievement tests. Within this program, some students are identified on the basis of their academic achievement and performance as high achieving, and placed together in a classroom with a teacher who modifies curriculum and instruction to meet the academic needs of these students. Other students are identified as above average, average, low average, low, or special education for placement in heterogeneous classrooms, in which students are flexibly grouped and regrouped for instructional purposes. There are five classrooms per grade level and each year one classroom has the cluster of high achieving students, with the remainder of this class comprised of average, low average, and low achieving students. The other four classrooms each have a heterogeneous mix of students who achieve at above average, average, low average, and low levels. Additionally, two of these classrooms have clusters of special needs students who receive Title 1 assistance in math and reading, or who receive assistance from a special education teacher-consultant. By arranging classes in this manner, each heterogeneous classroom has a group of above average achieving students, and the use of resource personnel is maximized.
General Background
Several analyses of studies regarding ability grouping in elementary schools (Kulik, 1992; Kulik & Kulik, 1984, 1985, 1992; Rogers, 1991; Slavin, 1987) have been completed; however, only six studies could be located that examined the effects of ability grouping on gifted students in schools that used a cluster grouping model (Hoover et al., 1993; Ivey, 1965; LaRose, 1986; Long, 1957; Simpson & Martinson, 1961; Ziehl, 1962). All of these studies were concerned with the effects of cluster grouping on gifted students, and none examined the effects on students of other achievement levels. Additionally four of these studies are over 30 years old and may not apply to current educational settings. Cluster grouping is commonly suggested as a programming option for gifted students (Balzer & Siewert, 1990; Brown, Archambault, Zhang, & Westberg, 1994; Davis & Rimm, 1985; Kulik & Kulik, 1991; LaRose, 1986; McInerney, 1983; New York State Dept. of Education, 1982; Renzulli, 1994; Rogers, 1991; Winebrenner & Delvin, 1991) when, in fact, very little evidence exists regarding its impact on these students, and no existing research examines the impact of cluster grouping on all students (Hoover et al., 1993). It is surprising that since so many professionals advocate the use of cluster grouping, so little research actually exists regarding its effectiveness. A need clearly exists for empirical and qualitative evidence concerning the effects of cluster grouping, not only on high achieving students, but on other students as well.
Rationale for Cluster Grouping
The rationale for the total school cluster grouping used by the school that this study investigated is based upon the following issues discussed in the literature:
- The program is cost effective. Cluster grouping often exists in schools which can not afford additional personnel for a gifted and talented program. Hoover et al. (1993), LaRose (1986), Rogers (1991), Rogers and Span (1993), and Winebrenner and Delvin (1991) suggested that cluster grouping can be a solution when other programs are not affordable.
- Students are clustered with their intellectual peers. Rogers (1991) concluded, in her meta-analysis, that gifted students should spend the majority of their school day with students of similar abilities. Research by Schunk (1987) has shown that students learn from those who are like themselves in ability. Kulik and Kulik (1991) concluded that it is beneficial, with respect to achievement gains, for gifted students to be grouped together.
- Special needs students and the highest achieving students are placed with teachers who have had training and are interested in meeting these special needs. Kulik and Kulik (1984) noted that the greatest benefit for ability grouped gifted children occurred when there was curricular differentiation. Rogers (1991) noted that without training and commitment to providing appropriately challenging curricula, achievement gains would probably be insignificant.
- The highest achieving students are removed from other classrooms, thereby allowing new leaders and achievers to emerge. Kennedy (1989) studied the effects of gifted pull-out programs on the students who remained in the regular classroom, and found that achievement increased in the classroom when the gifted students were pulled-out for programming. Contrary to Oakes (1985) assertion that grouping harmed lower ability students, Kulik and Kulik (1992) and Rogers (1991) found no such evidence.
- Heterogeneous grouping is maintained while there is a deliberate reduction in the range of achievement levels that each teacher must teach. In this program, grouping within the classrooms was flexible as recommended by Renzulli (1994) and Slavin (1987). Students interacted with both intellectual and age peers on a continual basis, identification categories were used for placement, and teachers had a limited range of achievement levels in their classrooms.
- More efficient use of special education and Title I personnel is achieved by creating clusters of these students in one or two rooms instead of spreading them across five rooms. This allowed team teaching between teacher consultants, aides, and classroom teachers, while providing targeted students with more time with specialists.
- A high achieving group of students exists in every teacher’s classroom. Kennedy (1989) found that low and average ability students flourish when gifted students are not present and leading the competition in the regular classroom and Schunk (1987) indicated average and low ability students use children of similar ability as models instead of high ability children. By placing the highest achievers in a single room and above average students in the other classrooms, all students had the opportunity to grow.
- High expectations for all students are maintained across all classrooms. In her meta-analysis of research related to teacher expectations, Smith (1980) found that teacher expectations were linked to student learning, attitudes, and achievement. In addition, Brophy and Goodûs (1970) self-fulfilling prophecy model explained that students who are expected to achieve at high levels will do so, and conversely, students who are expected to achieve at low levels will not achieve at high levels.
Since 1988 when a cluster grouping program was implemented in the treatment school, a trend regarding the identification of students was observed by the program coordinator, district administrators, and teachers. Specifically, during the 3 years that students spent in the school cluster grouping program, more students were identified by teachers as high achieving or above average and fewer students were identified as low or low average. This trend, together with the paucity of research on cluster grouping, lead to the following research questions:
- Does a cluster grouping program affect teacher perceptions of student achievement as measured by teacher identification categories?
- How do students in the cluster grouping school compare with students from a similar school who are not involved in cluster grouping with regard to achievement?
Research Design and Sample
This study employed an ex post facto examination of quasi-experimental, non-equivalent comparison group intervention which used a purposive sample. The treatment sample included all students from the Class of 2000 (N=96) and Class of 2001 (N=104) from a small rural school district. These students were involved in the program from grades 2 through 5 that allowed for an examination of the program effects over time. A comparison school was selected on the basis of its similarity to the treatment school with regard to: geographic region, socioeconomic status, ethnicity, and school configuration and size. The comparison district did not have a program for gifted students, and made available for research student achievement data [Class of 2000 (N=68); Class of 2001 (N=69)].
Instrumentation
Student achievement in the treatment school was measured on a yearly basis using the Iowa Tests of Basic Skills (ITBS). The ITBS is a nationally recognized achievement assessment of the highest quality. For Form G, internal consistency and reliability coefficients are in the expected range of mid .80’s to low .90’s and stability reliabilities with a one year interval are in the .70 to .90 range (Willson, 1989).
The comparison school measured student achievement on a yearly basis using the California Achievement Test (CAT). The CAT is well constructed, current, and well documented with internal consistency reliabilities in the high .80’s and low .90’s and stability reliabilities in the .80 to .95 range (Airasian, 1989). Additionally, Airasian stated the CAT “compares very favorably to other achievement batteries of its genre such as. . .the Iowa Tests of Basic Skills” (p. 128). Thus, while the content of these two standardized tests is not identical, use of Normal Curve Equivalent (NCE) scores provided an achievement standing relative to the respective test’s norm in a group.
Data Analysis
Data were analyzed using descriptive statistics (means, frequencies, and percents) and repeated measure analyses of covariance using grade 2 as the covariate to equate the groups for initial differences.
To address research question one, data were collected on the yearly student identification categories (high achieving, above average, average, low average, low, or special education). During the three program years, 48% of the students from the Class of 2000 and 33% of the students from the Class of 2001 were identified as achieving at increased levels. The types of changes in identification categories are indicated in Table 1 and Table 2.
Table 1
Class of 2000: Changes in Identification Categories Over Three Program Years*
*Categories were: high achieving, above average, average, low average, low, or special education
Table 2
Class of 2001: Changes in Identification Categories Over Three Program Years*
*Categories were: high achieving, above average, average, low average, low, or special education
Additionally, the number of students identified as high achieving increased each year. For the Class of 2000, there were 10 third grade students identified as high achieving, but 23 students were identified as high achieving when they were in fifth grade. Further, for the Class of 2001, the number of students identified as high achieving grew from 15 to 23 between grades 3 and 5. For both of these classes of students, the number of students identified as low or low average decreased during the 3 program years.
To address research question two, the achievement scores from students who attended the treatment school were compared with achievement data from students who attended the comparison school. The NCE scores for each student on the total battery (ITBS: treatment; CAT: comparison) were used in two repeated measures analyses of covariance, one for the Class of 2000 and one for the Class of 2001. Students were statistically equated on achievement using the grade 2 scores as the covariate (significant covariate at p<.05). Adjusted and unadjusted means are displayed in Table 3. The results indicated that there were significant interactions between group and total battery NCE scores for the Class of 2000 (F=(2,304), p<.01) and for the Class of 2001 (F=(2,334), (p<.01). Effect Sizes of .14 and .10, respectively, indicated that the results are practically significant (Cohen, 1985). Interaction plots of adjusted means are depicted in Figures 1 and 2.
Table 3
Unadjusted and Adjusted Means for NCE Total Scores Grades 3 through 5 for the Class of 2000 and Class of 2001
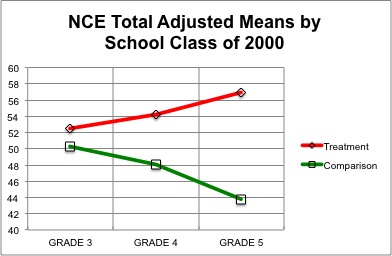
Figure 1. Interaction of NCE total scores by school for the Class of 2000.
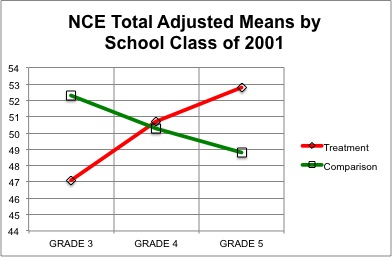
Figure 2. Interaction of NCE total scores by school for the Class of 2001.
During the 3 years that students were involved in the cluster grouping program, their achievement increased significantly when compared to similar students from a school that did not use cluster grouping. Additionally, during each of the 3 years of the program, more students were identified by teachers as high achieving, indicating that not only were achievement scores increasing, but that teachers were identifying students who were not initially recognized as high achieving. This may be due to the fact that high achieving students were clustered in one classroom, thereby allowing students in other classrooms to be recognized as high achieving. It is encouraging that not only did the identification categories of many students increase during the 3 program years, but that this was followed by an overall increase in achievement as measured by the Iowa Tests of Basic Skills.
The implications are that when a cluster grouping model is implemented, there may be a positive effect on the achievement and identification of all students, not just those identified and placed in the cluster for high ability students. According to the model in the treatment school and the review of literature, this is most likely when teachers have training in tailoring curriculum and instruction to the individual needs of students and when teacher expectations are high for all students.
This study provides a basis for further, controlled research regarding the effects of cluster grouping on the achievement and identification of students. A follow-up investigation will be conducted into the classroom practices of the teachers involved in this program.